
It is psychedelic folk knowledge that hallucinogenic drugs act primarily by agonism (activation) or partial agonism of the 5-HT2A, and to a lesser degree the 5-HT2C, receptors. Most users also know that 5-HT stands for serotonin, one of the major neurotransmitters of the brain, and 2A/2C are specific subtypes of serotonin receptors. Usually, there is little appreciation that these drugs also activate/inhibit a range of other neural processes. In fact, psychedelics are often referred to as ‘dirty drugs’ in the pharma industry, because they interact with such a wide variety of receptors.
In this post, we take a closer look at the work of Thomas Ray [1] from the University of Oklahoma, who painstakingly measured the receptor affinity of 35 psychedelic drugs for 51 receptors/transporters and ion channels as a part of the National Institute of Mental Health Psychoactive Drug Screening Program. It may not be obvious, but carrying out this number of experiments is a huge amount of work. The result however is a detailed molecular fingerprint of the drugs.
There are significant differences between receptors/transporters and ion channels, but generally they are all located in the membrane of neurons and are responsible for the secretion and intake of molecules from the intracellular space. For simplicity, we will simply refer to these molecules as receptors simply for the rest of this post.
Out of the 35 drugs, the author has made new measurements for 25, while for the remaining 10 he collected already existing data from the literature. Most of the assayed drugs are classic hallucinogens, but there were also 3 control substances. These are structurally similar to psychedelics, but are not psychoactive. Additionally, non-classical hallucinogens (THC, ibogaine and the active component from Salvia divinorum, salvinorin A) and morphine has been assayed as well to provide a contrast. Figure 1 below shows the structure of all assayed molecules.
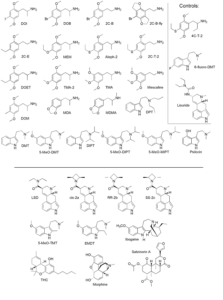 Fig 1: List of the assayed drugs. The top area shows the 25 chemicals (including the 3 non-psychoactive controls) for which this study made novel measurements. For the bottom 10, data was collected from the literature. Note the structural similarity among the substances.
So, what was measured exactly? The quantity Ki is the so-called equilibrium dissociation constant, and it is the concentration at which the receptor has reached half of its peak activity. Somewhat counterintuitively, the lower the Ki value is, the higher is the affinity (the less of the substance is required for activation). To reverse the scale and to take into account the orders of magnitudes of the measured values, the original Ki values were converted to a different scale denoted by pKi. Technically, pKi is the neg-log transform of the Ki, i.e. pKi=-log(10Ki). Measured this way, the higher the pKi value is the larger the affinity is, and a unit difference corresponds to a tenfold increase in affinity, i.e. a substance with pKi=3 has 10 times the affinity to a given receptor compared to another substance with pKi=2. Additionally, for each drug the highest affinity has been rescaled such that pKi=4. This normalisation ‘factors out’ the absolute potency of the substance and allows to focus on the relative affinities at distinct sites.
While the previous paragraph is a bit technical, it is worth understanding it before looking at Fig 2 below, which shows the affinity of various recreational substances to receptors.
Fig 1: List of the assayed drugs. The top area shows the 25 chemicals (including the 3 non-psychoactive controls) for which this study made novel measurements. For the bottom 10, data was collected from the literature. Note the structural similarity among the substances.
So, what was measured exactly? The quantity Ki is the so-called equilibrium dissociation constant, and it is the concentration at which the receptor has reached half of its peak activity. Somewhat counterintuitively, the lower the Ki value is, the higher is the affinity (the less of the substance is required for activation). To reverse the scale and to take into account the orders of magnitudes of the measured values, the original Ki values were converted to a different scale denoted by pKi. Technically, pKi is the neg-log transform of the Ki, i.e. pKi=-log(10Ki). Measured this way, the higher the pKi value is the larger the affinity is, and a unit difference corresponds to a tenfold increase in affinity, i.e. a substance with pKi=3 has 10 times the affinity to a given receptor compared to another substance with pKi=2. Additionally, for each drug the highest affinity has been rescaled such that pKi=4. This normalisation ‘factors out’ the absolute potency of the substance and allows to focus on the relative affinities at distinct sites.
While the previous paragraph is a bit technical, it is worth understanding it before looking at Fig 2 below, which shows the affinity of various recreational substances to receptors.
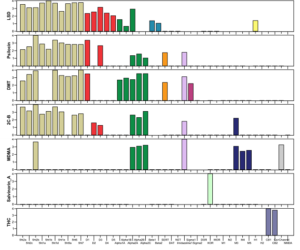 Figure 2: Receptor affinity profiles of common recreational substances, ordered by receptor type. The vertical axis shows the normalised pKi values and the horizontal axis is a list of forty-two receptors, grouped by receptor type. Colours represent classes of receptors, i.e. serotonin receptors (beige), dopamine receptors (red), etc. Note that classic psychedelics have a similar and broad activation profile, while THC and Salvinorin A are much more specific. The figure has been truncated to show only commonly known psychoactive substances.
The paper also examines the ‘breadth’ of the activation patterns, which is the inverse of selectivity of drugs. This means that the larger the breadth of a drug is, the more receptors it is interacting with. The authors define 3 schemes to convert the pKi values to breadth, these are denoted by B, Bsq and Bexp. It is beyond the scope of this post to go into the differences, but they all measure how evenly affinity is distributed among the receptors. Table 1 below shows the ranking of drugs by breadth. Note that as can be expected from Fig 2, drugs with well-defined interactions (e.g. salvinorin A) are at the bottom of the list, while classic psychedelics are near the top.
Figure 2: Receptor affinity profiles of common recreational substances, ordered by receptor type. The vertical axis shows the normalised pKi values and the horizontal axis is a list of forty-two receptors, grouped by receptor type. Colours represent classes of receptors, i.e. serotonin receptors (beige), dopamine receptors (red), etc. Note that classic psychedelics have a similar and broad activation profile, while THC and Salvinorin A are much more specific. The figure has been truncated to show only commonly known psychoactive substances.
The paper also examines the ‘breadth’ of the activation patterns, which is the inverse of selectivity of drugs. This means that the larger the breadth of a drug is, the more receptors it is interacting with. The authors define 3 schemes to convert the pKi values to breadth, these are denoted by B, Bsq and Bexp. It is beyond the scope of this post to go into the differences, but they all measure how evenly affinity is distributed among the receptors. Table 1 below shows the ranking of drugs by breadth. Note that as can be expected from Fig 2, drugs with well-defined interactions (e.g. salvinorin A) are at the bottom of the list, while classic psychedelics are near the top.
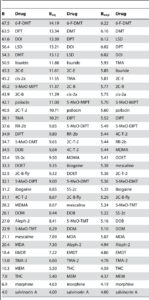 Table 1: The ordering of the breadth of drugs. The higher a drug is on the list, the more widespread its activity is. Also note that the order of drugs does not change much with the modification of the normalisation scheme (whether B, Bsq or Bexp was used).
A probably more revealing way to represent the same data is the proportional breadth (Bp), which is an individual drug’s interaction with one receptor or group of receptors, as a proportion of the drug’s total interaction with all receptors. Table 2 below gives the Bp value of some common drugs to the serotonin system (that is, all 5-HT receptors).
Table 1: The ordering of the breadth of drugs. The higher a drug is on the list, the more widespread its activity is. Also note that the order of drugs does not change much with the modification of the normalisation scheme (whether B, Bsq or Bexp was used).
A probably more revealing way to represent the same data is the proportional breadth (Bp), which is an individual drug’s interaction with one receptor or group of receptors, as a proportion of the drug’s total interaction with all receptors. Table 2 below gives the Bp value of some common drugs to the serotonin system (that is, all 5-HT receptors).
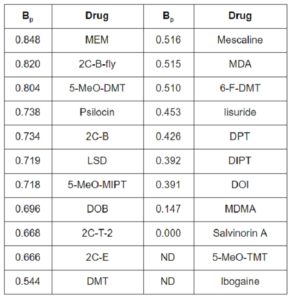 Table 2: The proportional breadth of substances to the family of 5-HT receptors. Note that even classic hallucinogens like mescaline have a proportional breadth of about 0.52, meaning that about 48% of its activity is through non-serotonergic systems!
The main value of this study is the sheer volume of quantitative measurements it provides researchers and drug nerds. The activation pattern of psychedelics share some common elements (e.g. high levels of 5-HT2A activation), but there are differences simultaneously (e.g. LSD has a much higher dopaminergic activity relative to psilocybin). Our understanding of the brain suggests that the differences in receptor affinities are responsible for the differences between the experiences that distinct psychedelics induce.
Taking a step backwards and evaluating the totality of the experiments, the main take away message is that psychedelics are not nearly as selective as most people believe. In this assay psychedelics interacted with 42 of the different sites, although the majority of the activity can be ascribed to 18 receptors. The primary targets are elements of the serotonin system, but there are significant other interactions as well. Most strikingly, 30% of the activity of both LSD and psilocybin are not related to serotonin, although most users would believe that to be the case!
Posted by Balázs Szigeti
References
[1]: Ray, Thomas S. “Psychedelics and the human receptorome.” PLoS One 5.2 (2010): e9019.
Table 2: The proportional breadth of substances to the family of 5-HT receptors. Note that even classic hallucinogens like mescaline have a proportional breadth of about 0.52, meaning that about 48% of its activity is through non-serotonergic systems!
The main value of this study is the sheer volume of quantitative measurements it provides researchers and drug nerds. The activation pattern of psychedelics share some common elements (e.g. high levels of 5-HT2A activation), but there are differences simultaneously (e.g. LSD has a much higher dopaminergic activity relative to psilocybin). Our understanding of the brain suggests that the differences in receptor affinities are responsible for the differences between the experiences that distinct psychedelics induce.
Taking a step backwards and evaluating the totality of the experiments, the main take away message is that psychedelics are not nearly as selective as most people believe. In this assay psychedelics interacted with 42 of the different sites, although the majority of the activity can be ascribed to 18 receptors. The primary targets are elements of the serotonin system, but there are significant other interactions as well. Most strikingly, 30% of the activity of both LSD and psilocybin are not related to serotonin, although most users would believe that to be the case!
Posted by Balázs Szigeti
References
[1]: Ray, Thomas S. “Psychedelics and the human receptorome.” PLoS One 5.2 (2010): e9019.
Fig 1: List of the assayed drugs. The top area shows the 25 chemicals (including the 3 non-psychoactive controls) for which this study made novel measurements. For the bottom 10, data was collected from the literature. Note the structural similarity among the substances.
So, what was measured exactly? The quantity Ki is the so-called equilibrium dissociation constant, and it is the concentration at which the receptor has reached half of its peak activity. Somewhat counterintuitively, the lower the Ki value is, the higher is the affinity (the less of the substance is required for activation). To reverse the scale and to take into account the orders of magnitudes of the measured values, the original Ki values were converted to a different scale denoted by pKi. Technically, pKi is the neg-log transform of the Ki, i.e. pKi=-log(10Ki). Measured this way, the higher the pKi value is the larger the affinity is, and a unit difference corresponds to a tenfold increase in affinity, i.e. a substance with pKi=3 has 10 times the affinity to a given receptor compared to another substance with pKi=2. Additionally, for each drug the highest affinity has been rescaled such that pKi=4. This normalisation ‘factors out’ the absolute potency of the substance and allows to focus on the relative affinities at distinct sites.
While the previous paragraph is a bit technical, it is worth understanding it before looking at Fig 2 below, which shows the affinity of various recreational substances to receptors.
Figure 2: Receptor affinity profiles of common recreational substances, ordered by receptor type. The vertical axis shows the normalised pKi values and the horizontal axis is a list of forty-two receptors, grouped by receptor type. Colours represent classes of receptors, i.e. serotonin receptors (beige), dopamine receptors (red), etc. Note that classic psychedelics have a similar and broad activation profile, while THC and Salvinorin A are much more specific. The figure has been truncated to show only commonly known psychoactive substances.
The paper also examines the ‘breadth’ of the activation patterns, which is the inverse of selectivity of drugs. This means that the larger the breadth of a drug is, the more receptors it is interacting with. The authors define 3 schemes to convert the pKi values to breadth, these are denoted by B, Bsq and Bexp. It is beyond the scope of this post to go into the differences, but they all measure how evenly affinity is distributed among the receptors. Table 1 below shows the ranking of drugs by breadth. Note that as can be expected from Fig 2, drugs with well-defined interactions (e.g. salvinorin A) are at the bottom of the list, while classic psychedelics are near the top.
Table 1: The ordering of the breadth of drugs. The higher a drug is on the list, the more widespread its activity is. Also note that the order of drugs does not change much with the modification of the normalisation scheme (whether B, Bsq or Bexp was used).
A probably more revealing way to represent the same data is the proportional breadth (Bp), which is an individual drug’s interaction with one receptor or group of receptors, as a proportion of the drug’s total interaction with all receptors. Table 2 below gives the Bp value of some common drugs to the serotonin system (that is, all 5-HT receptors).
Table 2: The proportional breadth of substances to the family of 5-HT receptors. Note that even classic hallucinogens like mescaline have a proportional breadth of about 0.52, meaning that about 48% of its activity is through non-serotonergic systems!
The main value of this study is the sheer volume of quantitative measurements it provides researchers and drug nerds. The activation pattern of psychedelics share some common elements (e.g. high levels of 5-HT2A activation), but there are differences simultaneously (e.g. LSD has a much higher dopaminergic activity relative to psilocybin). Our understanding of the brain suggests that the differences in receptor affinities are responsible for the differences between the experiences that distinct psychedelics induce.
Taking a step backwards and evaluating the totality of the experiments, the main take away message is that psychedelics are not nearly as selective as most people believe. In this assay psychedelics interacted with 42 of the different sites, although the majority of the activity can be ascribed to 18 receptors. The primary targets are elements of the serotonin system, but there are significant other interactions as well. Most strikingly, 30% of the activity of both LSD and psilocybin are not related to serotonin, although most users would believe that to be the case!
Posted by Balázs Szigeti
References
[1]: Ray, Thomas S. “Psychedelics and the human receptorome.” PLoS One 5.2 (2010): e9019.


